
Infographics are the hottest way to present information on the Web
right now. People are drawn to visuals, so charts, graphs and pictorials
are often the best way to show data in a way that people will read and
understand.
One of the newest Google Apps allows you to create charts and share them on the web with just a few minutes of configuration.

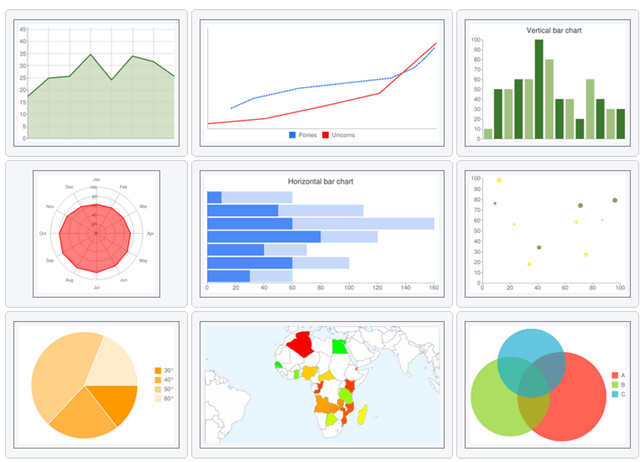
First, click the picture of the kind of chart you want to create.

Enter the data you want to appear in your chart.

Next, give your chart a title. You can also customize the font size and color for the title.

Enter the dimensions for your chart.

Choose a position and size for your chart’s legend.

Choose the fill style for your chart.

Changes made to your chart appear in real time at the top right of the page. A link to your chart is located directly below the preview. Copy and paste the link into an email or share it on your favorite social networking website. You can also embed the chart on a webpage using the HTML code directly below the link.

You can also embed the chart by clicking the Embed with Visualization API button.

Google’s Image Chart Editor creates colorful, easy-to-read and easy-to-make charts. We like that a URL is automatically generated for each chart, and you can continue to edit a chart as often as you like. The Image Chart Editor is currently in Beta, but is fully functional.
One of the newest Google Apps allows you to create charts and share them on the web with just a few minutes of configuration.

First, click the picture of the kind of chart you want to create.
Enter the data you want to appear in your chart.

Next, give your chart a title. You can also customize the font size and color for the title.

Enter the dimensions for your chart.

Choose a position and size for your chart’s legend.

Choose the fill style for your chart.

Changes made to your chart appear in real time at the top right of the page. A link to your chart is located directly below the preview. Copy and paste the link into an email or share it on your favorite social networking website. You can also embed the chart on a webpage using the HTML code directly below the link.

You can also embed the chart by clicking the Embed with Visualization API button.

Google’s Image Chart Editor creates colorful, easy-to-read and easy-to-make charts. We like that a URL is automatically generated for each chart, and you can continue to edit a chart as often as you like. The Image Chart Editor is currently in Beta, but is fully functional.
No comments:
Post a Comment